Naite Key Autocomplete
When typingNaite.t(", Naite.del(", Naite.get(", all Naite keys in the project are autocompleted.
How It Works
The Extension scans all TypeScript files in the workspace and collects keys used inNaite.t() calls. This key list is provided as autocomplete candidates.
Key Navigation
You can quickly jump to definition and reference locations from Naite key strings.Go to Definition
- Shortcut: F12
- Action: Jump to
Naite.t("key")location
Go to References
- Shortcut: Shift+F12
- Action: Display list of
Naite.get("key"),Naite.del("key")locations
Cmd+Click
Cmd+Click behavior depends on VS Code settings and jumps to definition or references:editor.gotoLocation.multipleDefinitions: Behavior when multiple definitions existeditor.gotoLocation.multipleReferences: Behavior when multiple references exist
Key Highlighting
Applies visual decoration to Naite key strings for easy identification in code.Settings
Enable/disable withsonamu.naite.decoration.enabled, and change style with sonamu.naite.decoration.style:
underline(default)bolditalicunderline boldunderline italicnone
Hover Information
Hover over a Naite key to display usage information for that key.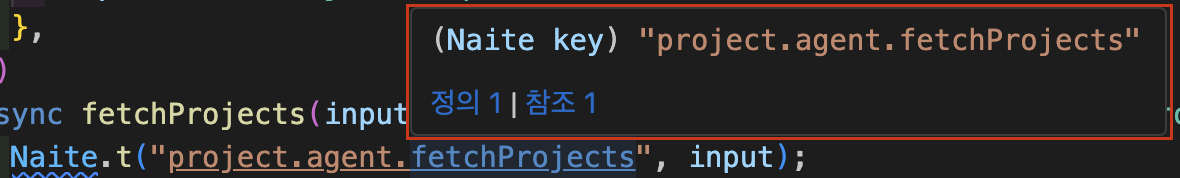
Inline Value Display
After running tests, displays recorded values inline next toNaite.t() calls.
Settings
sonamu.naite.runtimeValue.enabled: Enable/disable feature (default:true)sonamu.naite.runtimeValue.maxLength: Maximum length of displayed value (default:50)
Naite Trace Viewer
A dedicated viewer to check all values recorded withNaite.t() during test execution in real-time.
Opening
RunSonamu: Open Naite Trace Viewer from the Command Palette, or it opens automatically when running tests.
Key Features
Grouping by Test Traces are displayed grouped by test suite and case.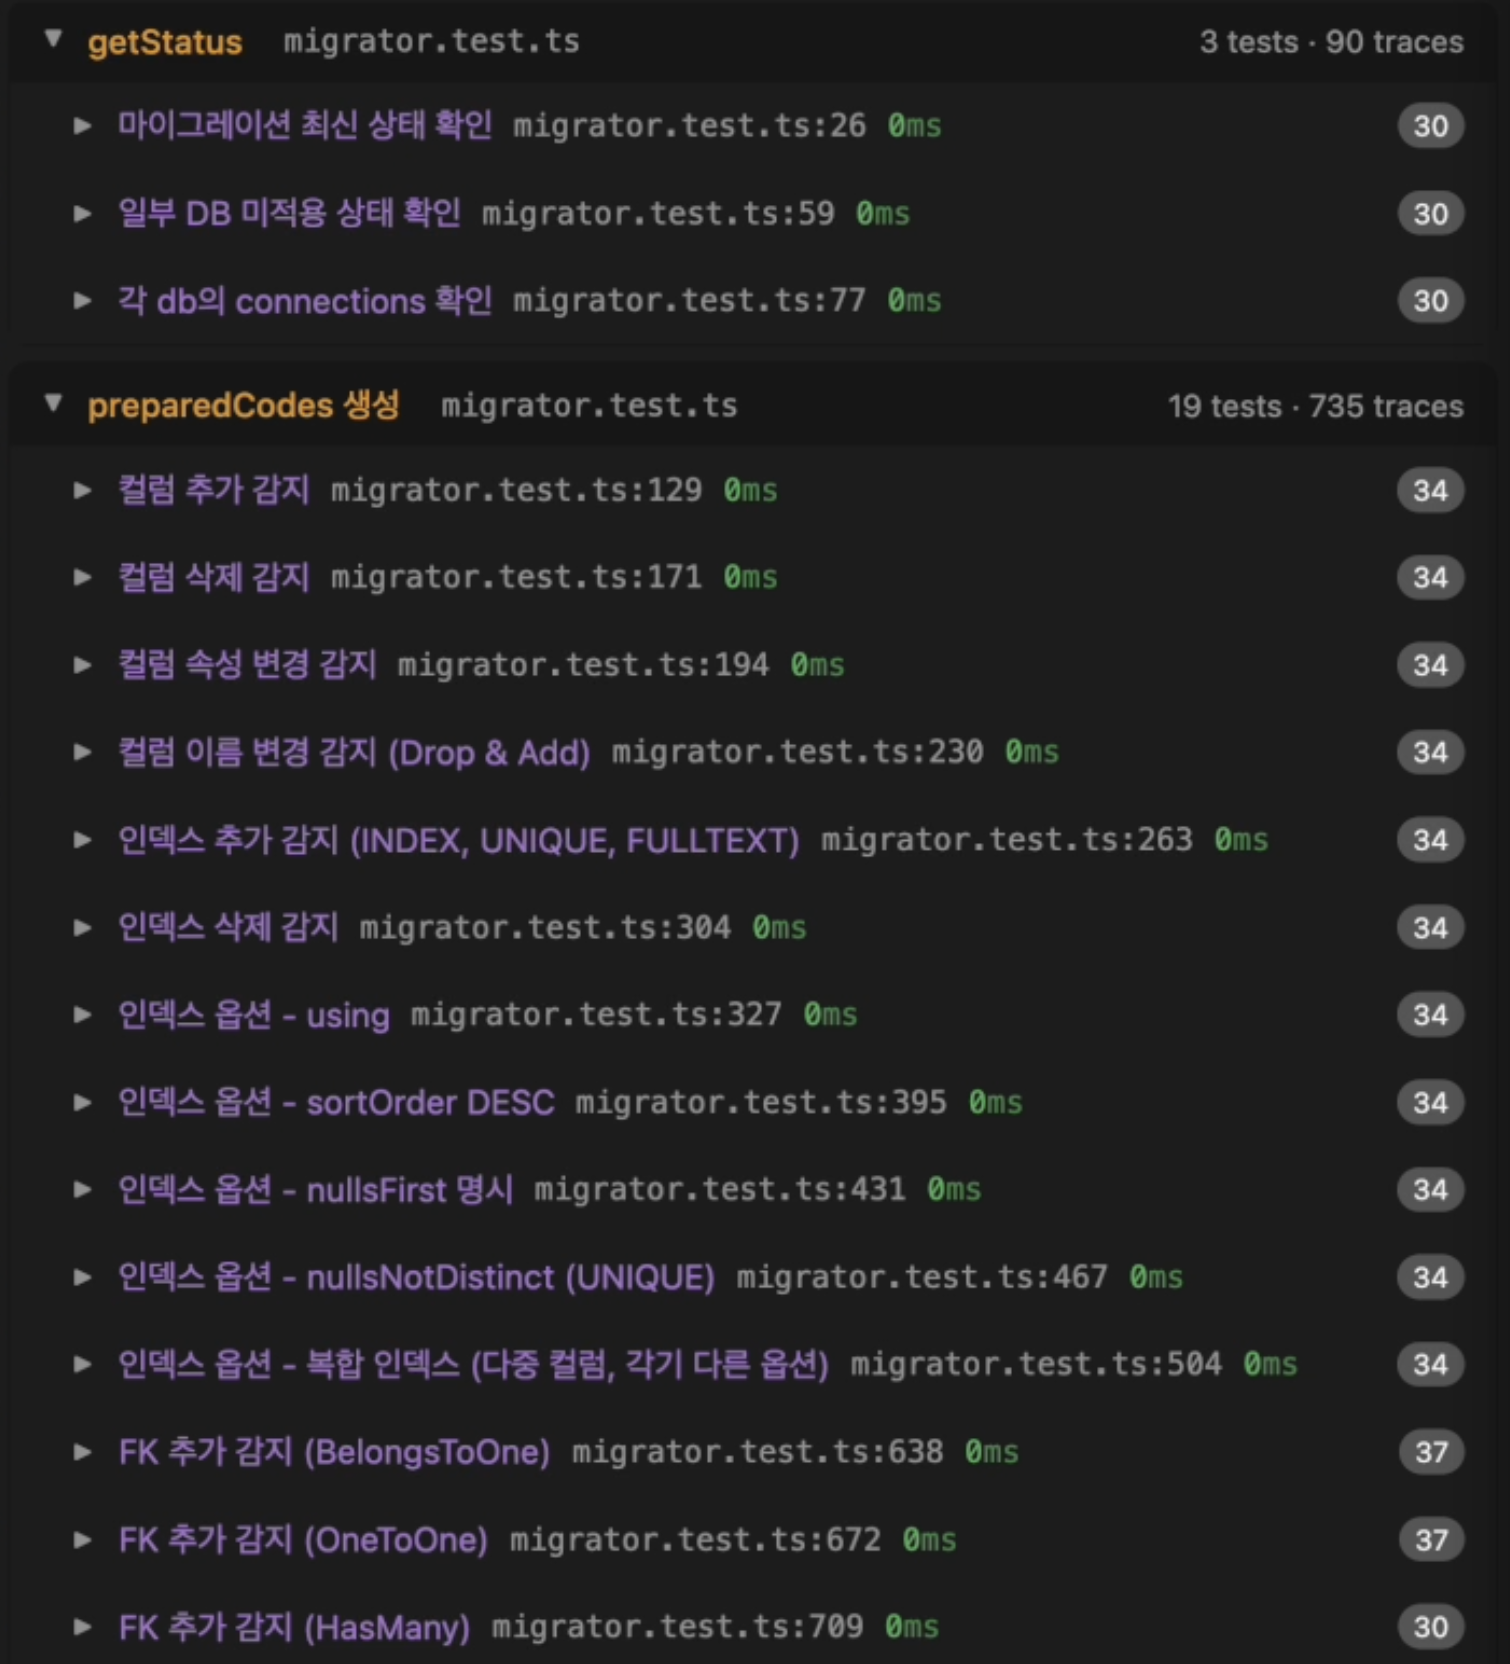
- Key name
- Recorded value (JSON format)
- File path and line number
- Recording time
Naite.t() call location.
Vitest Setup
To display test case line numbers, setincludeTaskLocation: true in vitest.config.ts:
Symbol Search
Search for Naite keys in Workspace Symbol Search.- Shortcut: Cmd+T
- Usage: Type key name to find all usage locations
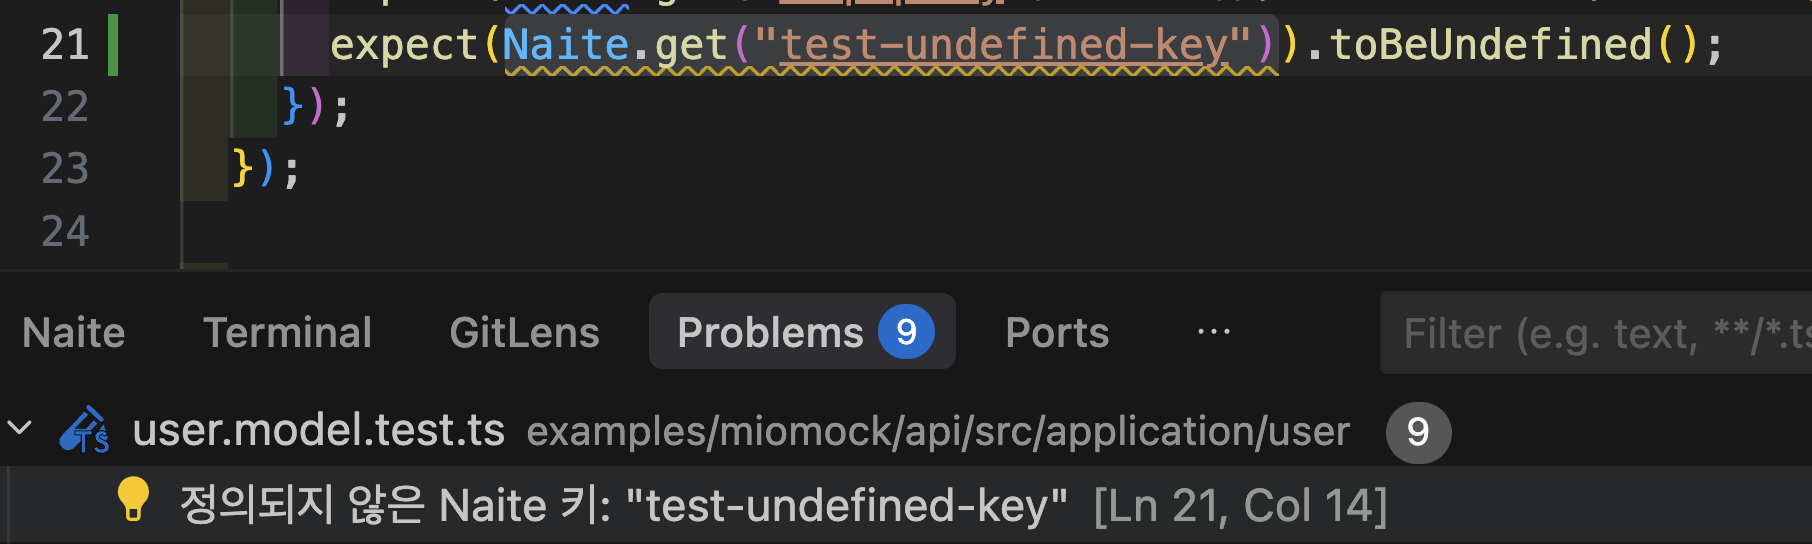
Undefined Key Warnings
Displays warnings whenNaite.get() or Naite.del() references a key that hasn’t been defined with Naite.t(). Warnings can be viewed in the VS Code Problems panel (Cmd+Shift+M).
View Container
The Extension adds a “Naite” View Container to the panel area.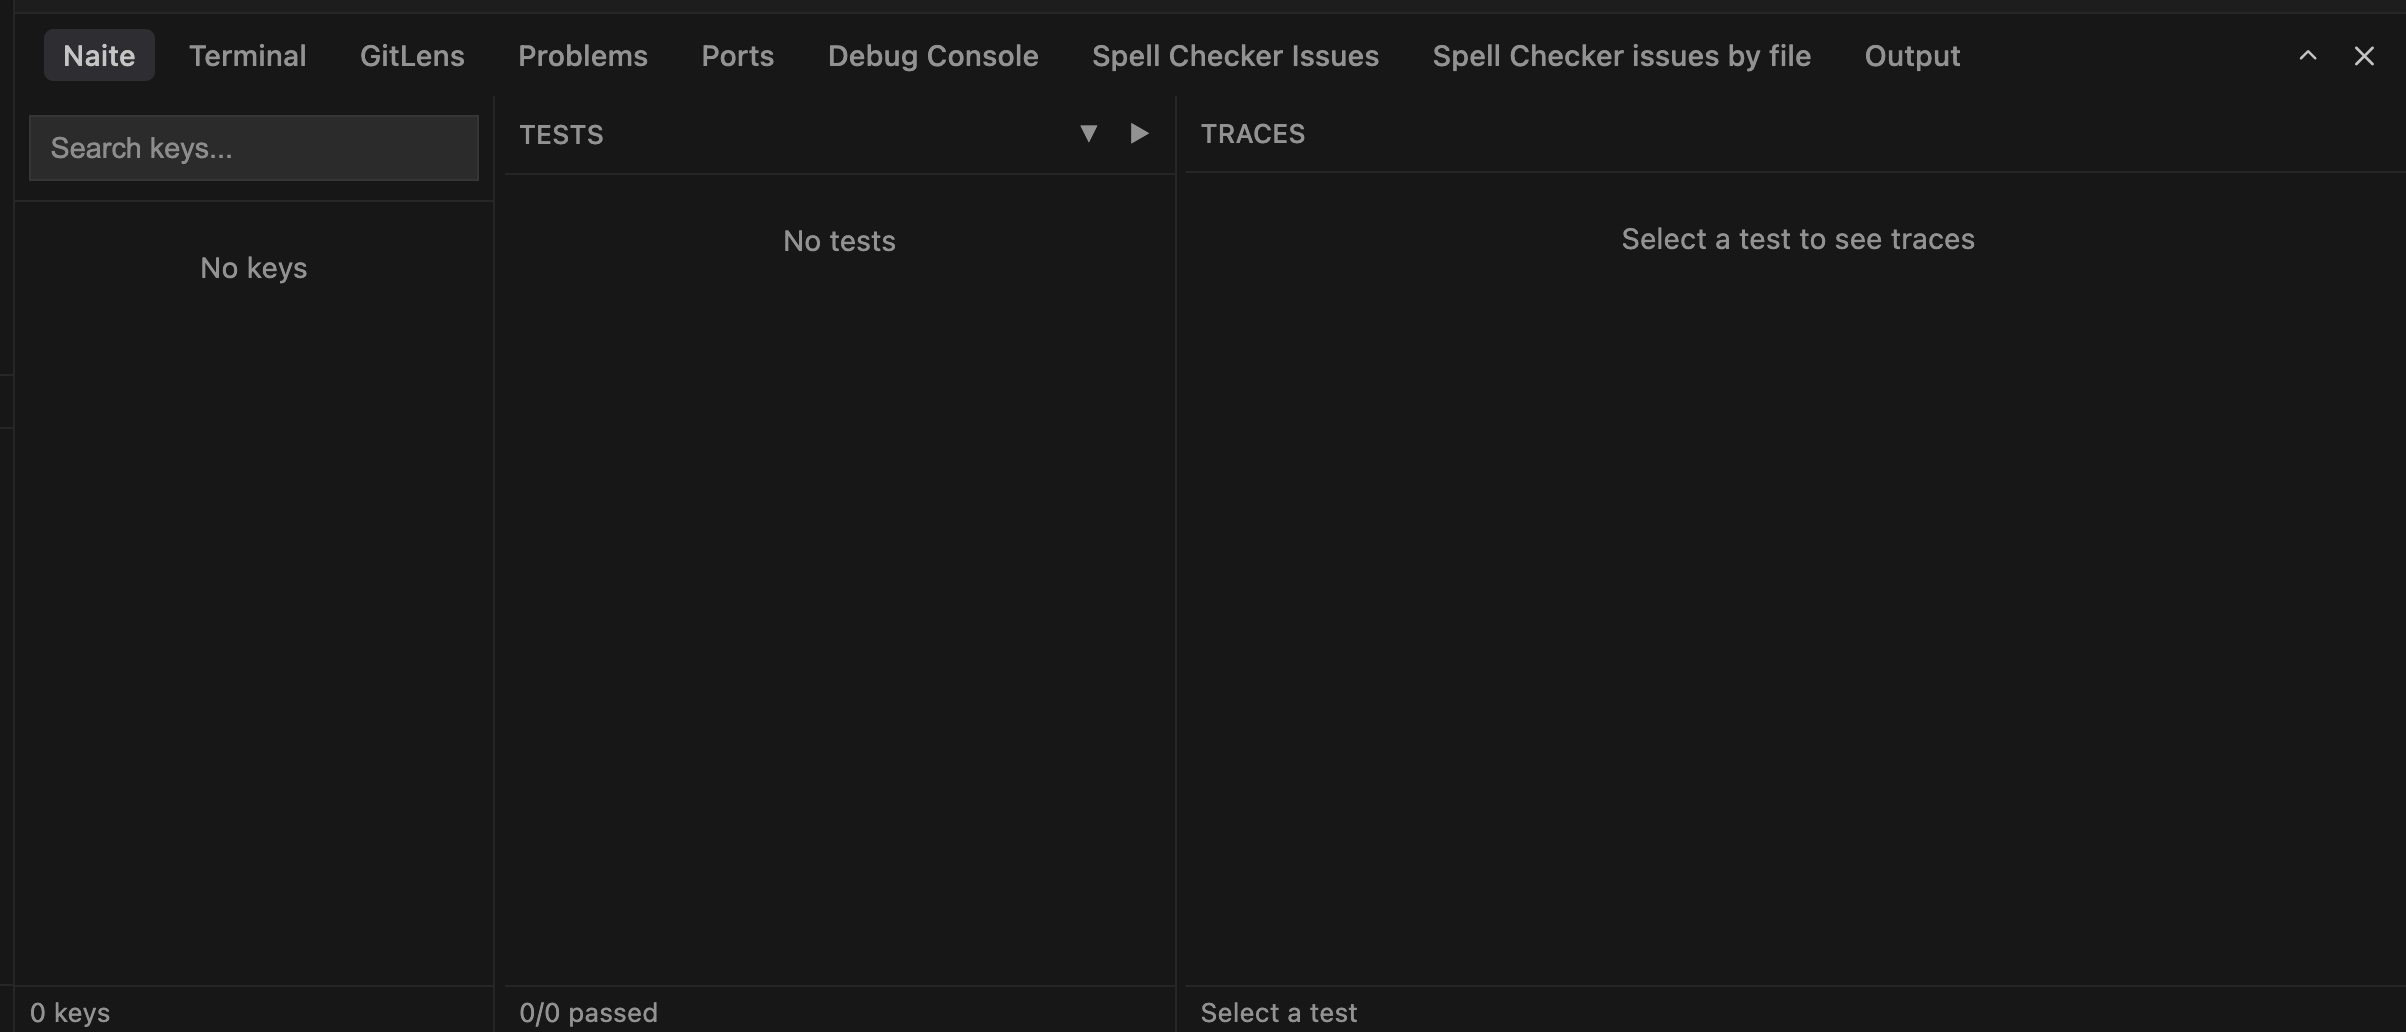
Status Bar Messages
Displays notification messages in the status bar when Naite tracker actions occur (key add, delete, etc.). Enable/disable withsonamu.naite.statusBarMessages.enabled setting (default: true).